Refreshment Course for Data Science and Business Intelligence Certification
Introduction
When we are asked to prove our credibility in a field, for example, as doctors we are required to show our licenses. In many professions, certification is one of the main ways to demonstrate credibility.
For instance, there are internationally recognized certifications such as AWS or GCP. Many countries or third-party institutions also provide their own certifications. In Indonesia, an official government body is responsible for this. In this post, we will discuss some of their certifications in data science and business intelligence, as well as the refresher materials available for preparation.
Data Science Certification
Each certification comes with predefined units that the test taker must complete in order to become certified. For example, in Data Science, the required units include:
Data Collection
Data Exploration
Data Validation
Data Definition
Data Construction
Data Labeling
Model Building
Model Evaluation
While I am not entirely sure whether these units fully reflect the best practices of a modern data science workflow, I believe they could be simplified and better aligned with current standards, such as:
Data Collection
Data Understanding
Data Exploration
Data Preprocessing
Model Development
Model Deployment
It is also worth noting that these units were most likely designed before the pre-LLM era. Today, with the advancement of generative AI, many of these steps could potentially be automated or significantly accelerated. :D
Data Collection
The first step is data collection. When taking a certification, the provider usually provides both the dataset and the goal for the test takers. However, there may be cases where you need to find and collect the data yourself. If so, what should you do?
First, you need to determine what kind of data you want to analyze. For example:
Stock data, if you are role-playing as an investment analyst.
Revenue data, if you are role-playing as a company analyst aiming to boost revenue.
Customer churn data, if your goal is to prevent the company from losing customers, etc.
It is important to remember that every type of data comes with its own characteristics, which will influence how you approach analysis.
Second, after deciding on the type of data, you should identify platforms to find open datasets, such as Kaggle. Alternatively, if you have access to proprietary data and permission to use it, you can work with that as long as privacy and confidentiality are preserved.
For simplicity, we will use the Telco customer churn dataset, which can be found [1].
Data Understanding
After deciding on the dataset, it is essential to understand what the data is about. I usually find that reading the data’s description and metadata is very helpful. Here is what the provider states about the Telco dataset:
Predict behavior to retain customers. You can analyze all relevant customer data and develop focused customer retention programs. The raw data contains 7043 rows (customers) and 21 columns (features)." [IBM Sample Data Sets]
From this, we know that the dataset contains 7,043 customers with 21 properties. Taking a quick glance at the data, we can notice some properties that are likely of most interest, Churn. By this time, we may come up with several questions, such as:
What proportion of customers have churned?
What are the main reasons customers decide to churn?
How does customer churn affect the company?
How can we prevent more customers from churning?
What strategies should we implement?
From my perspective, data science is essentially a workflow designed to answer these questions. This can be achieved by building predictive models to simulate customer behavior and ultimately create the desired outcome; in this case, retaining more customers.
Data Exploration
After understanding the data and defining the objectives, the next step is usually to conduct Exploratory Data Analysis (EDA) to gain deeper insights. In the conventional approach, this often begins with tasks such as:
reading the dataset with pandas,
performing sampling,
generating summaries,
and creating basic plots, etc.
While effective, these steps can be somewhat repetitive, and, if I may say, a little tedious.
The Conventional Way (Tedious and Repetitive)
285
6202-DYYFX
Female
0
No
No
22
Yes
Yes
Fiber optic
No
...
No
No
No
No
One year
Yes
Credit card (automatic)
76.00
1783.6
No
4323
3707-LRWZD
Female
0
No
No
32
Yes
Yes
Fiber optic
No
...
No
No
Yes
No
One year
No
Electronic check
84.05
2781.85
Yes
5302
9700-ISPUP
Female
0
Yes
Yes
10
Yes
No
DSL
No
...
No
Yes
No
Yes
Month-to-month
Yes
Electronic check
65.50
616.9
No
171
1875-QIVME
Female
0
Yes
No
2
Yes
Yes
Fiber optic
No
...
Yes
Yes
Yes
Yes
Month-to-month
Yes
Electronic check
104.40
242.8
Yes
6739
6994-KERXL
Male
0
No
No
4
Yes
No
DSL
No
...
No
No
No
Yes
Month-to-month
Yes
Electronic check
55.90
238.5
No
868
3313-QKNKB
Male
0
Yes
No
59
Yes
Yes
Fiber optic
No
...
No
No
No
Yes
One year
No
Electronic check
85.55
5084.65
Yes
5102
9070-BCKQP
Female
0
Yes
No
72
Yes
Yes
Fiber optic
Yes
...
Yes
Yes
Yes
Yes
Two year
Yes
Credit card (automatic)
110.15
7881.2
No
6444
6302-JGYRJ
Male
0
No
Yes
31
Yes
Yes
DSL
No
...
No
Yes
Yes
Yes
One year
Yes
Mailed check
79.45
2587.7
Yes
3137
4567-AKPIA
Female
0
Yes
Yes
41
Yes
Yes
Fiber optic
No
...
Yes
Yes
Yes
Yes
One year
Yes
Bank transfer (automatic)
109.10
4454.25
No
6360
8073-IJDCM
Female
0
No
No
1
Yes
No
No
No internet service
...
No internet service
No internet service
No internet service
No internet service
Month-to-month
Yes
Mailed check
20.30
20.3
Yes
10 rows × 21 columns
Automate it! (Minimal Effort, Maximal Gain)

Data Preprocessing
Model Building
Low Code Machine Learning with PyCaret
As we can see in the Data Preprocessing and Model Building steps, these often involve repetitive workflows. At this point, we should ask ourselves: Is it really necessary to perform every step manually? Do these steps directly help us answer our main objective, in this case, preventing more customer churn, or could we use more automated tools as long as they allow us to achieve the same goal effectively?
nb
Naive Bayes
0.7789
0.8060
0.7789
0.7727
0.7741
0.4110
0.4139
0.0830
knn
K Neighbors Classifier
0.7716
0.7792
0.7716
0.7642
0.7667
0.3912
0.3932
0.0880
qda
Quadratic Discriminant Analysis
0.7576
0.7972
0.7576
0.7248
0.7100
0.2137
0.2494
0.0830
lr
Logistic Regression
0.7550
0.8296
0.7550
0.7408
0.6890
0.1566
0.2285
0.1650
rf
Random Forest Classifier
0.7501
0.7778
0.7501
0.7130
0.6983
0.1819
0.2174
0.1780
svm
SVM - Linear Kernel
0.7462
0.7937
0.7462
0.7132
0.6917
0.2081
0.2471
0.0870
ridge
Ridge Classifier
0.7385
0.7839
0.7385
0.6907
0.6592
0.0793
0.1278
0.0830
lda
Linear Discriminant Analysis
0.7385
0.7338
0.7385
0.6907
0.6592
0.0793
0.1278
0.0780
et
Extra Trees Classifier
0.7379
0.7473
0.7379
0.6890
0.6710
0.1069
0.1467
0.1600
lightgbm
Light Gradient Boosting Machine
0.7349
0.7311
0.7349
0.7270
0.7271
0.2888
0.2942
0.2100
dummy
Dummy Classifier
0.7347
0.5000
0.7347
0.5398
0.6223
0.0000
0.0000
0.0920
ada
Ada Boost Classifier
0.6848
0.7266
0.6848
0.7221
0.6956
0.2707
0.2786
0.1230
gbc
Gradient Boosting Classifier
0.6777
0.6702
0.6777
0.6892
0.6690
0.1716
0.1857
0.2200
dt
Decision Tree Classifier
0.5262
0.5046
0.5262
0.6230
0.5306
0.0122
0.0212
0.1240
Business Intelligence Certification
For Business Intelligence certification, the required units include:
Data Collection
Data Exploration
Data Validation
Data Definition
Data Construction
Data Integration
Dashbord Development
As of this case, I also believe they could be simplified, such as:
Data Collection
Data Understanding
Business-Centric Objective
Dashboard Development
Dashboard Deployment
Several steps, such as Data Integration, are omitted here, since in my view they align more closely with the responsibilities of data engineering rather than Business Intelligence.
Business-Centric Objective
We have covered part of Data Collection and Understanding before, now comes to the most important aspect of business intelligence, that is define the objective constrained by business-centric. This part will be heavily inspired by the Google Looker Guide 'The Art of Telling Stories With Data' that ca be accessed [2].
Choosing the Right Visualization
Who is your audience?
Is it an executive who is interested in overall business performance?
Is it the sales team that wants to determine whether or not they will hit their quota for the quarter?
Is it the marketing team that needs to determine if their social media and email campaigns are effective?
What is your goal?
Are you building something that is referential, such as a report? Or a visualization that’s meant to A CEO or CFO may want to understan how revenue this year compares to last year and the year before that.
Are you creating something that is operational, like a dashboard that people will continually check to help direct their workflow?
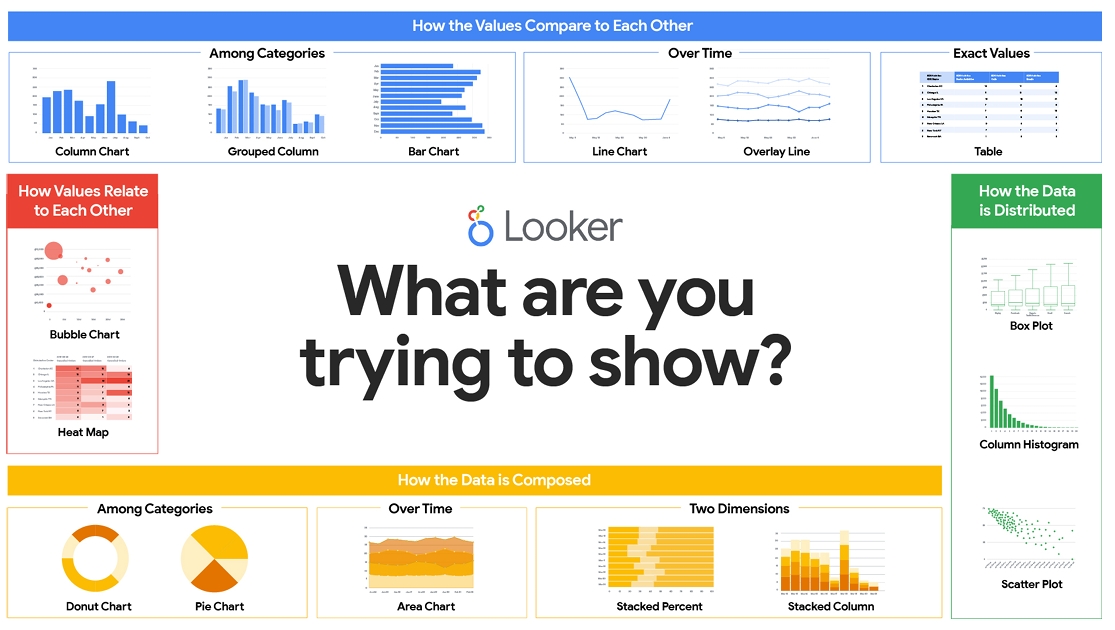
What are you trying to show or say?
Are you comparing data across different categories (bar chart)?
Are you highlighting changes over time (line chart)?
Are you presenting a picture of the full data set (scatterplot or histogram)? A clear understanding of all these factors will help you zero in on a visualization that effectively speaks to your audience.
Different Users Have Different Questions and Require Different Data

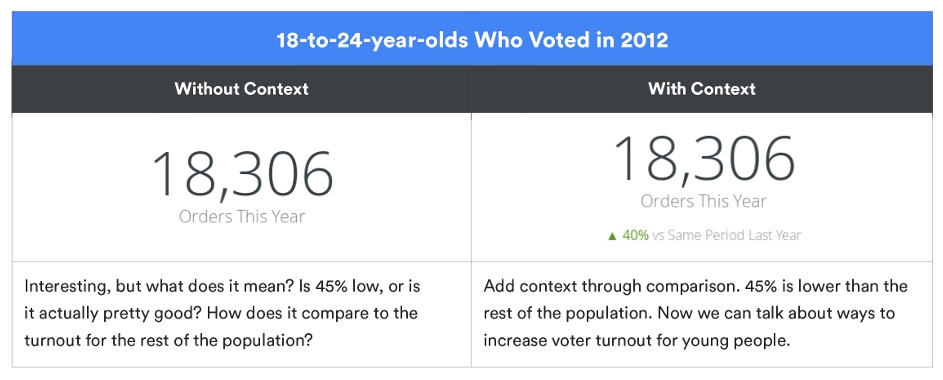
Give Context
Choosing The Right Chart
Use Case

PS
The example use case (BI dashboard) mentioned earlier [3]. was built using Tableau. Within the Business Intelligence ecosystem, there are many tools available, ranging from closed-source to open-source solutions.
What I would like to emphasize is that tools are just tools. As practitioners, we have the freedom to choose any technology stack, as long as it enables us to deliver insights and effectively address the business problem. You can even rely on something as simple as Excel, or take advantage of emerging Generative AI/LLM-based tools, such as LIDA [4].
Ultimately, while tools will continue to evolve, the fundamentals of Business Intelligence remain the same.
Last updated